
In the middle of last year, it looked as though I would finally realize my dream teaching assignment: an integrated English and world geography course for ninth graders. I was so excited to be able to teach about the settings of the literature we read in an interdisciplinary way. No longer would I navigate the border between text and context! The world was literally mine.
Like all plans born in 2020, this one wasn’t to be, at least not now. In July a septuagenarian colleague decided neither the prospect of returning face-to-face nor of teaching virtually was something that she was up for, so I picked up her sections of seniors.
But I was spending my quarantine summer taking National Geographic’s free “Mapping as a Visualization and Communication Tool in Your Classroom Course,” and I wanted to still find some ways to put those new understandings to use.
So here it is, how I’m teaching-geography-without-teaching-geography, five ways that English teachers can sneak maps into their curricula:
1. Take inventory of your reading list.
Maps help us to mentally process data, and one immediate application is in developing a picture of the literature that we teach. I created this map using the “my maps” feature of Google Maps to audit who and what I was teaching. I was able to layer authors’ origins, authors’ genders, and the settings of the books we read as part of my ninth-grade curriculum:

When you look at information in this way, patterns emerge. The literature that I teach seems to be largely Western. Other regions of the world are represented, but often by a single text. The map by itself isn’t an argument or evaluation, but this visualization helps me to ask some questions about what and how I’m teaching. Are there works in translation that I’m missing out on? Are the depictions of non-Western people in the literature we read authentic?
Here’s how to do this yourself:
2. Support students in reading comprehension.
In my new senior-level English class, we started the year reading Homer’s Iliad, the classic story of the Trojan War. Something like ¾ of the way through the epic poem, I realized that students were having trouble tracking the action of the plot because they didn’t have a visual understanding of the features of the physical environment. How was it significant that Helen and Priam are having a conversation on top of the city walls? Why was it such a big deal that the Trojan forces fought their way to the Myrmidon encampment of the Greek forces?
Last year I had students track the characters’ movement across Western Europe in The Count of Monte Cristo, and I know that experience helped them to understand an intricate plot based on deception and subterfuge.

So this year, if I had taken some time to sketch out – or have students sketch out – the world we were working with, the characters’ choices would have made much more sense to them. Oh well – now I know better for next year!
3. Explore setting and context.
My ninth-grade students also start the year with Greek mythology in the form of Homer’s Odyssey. I love to show them maps of Odysseus’s journey – even though he wasn’t a real character (as far as we know!), we can trace the origins of some of the myths to different actual locations.

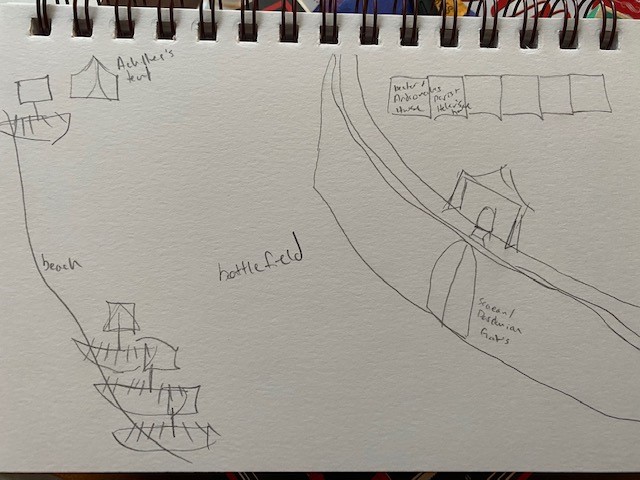
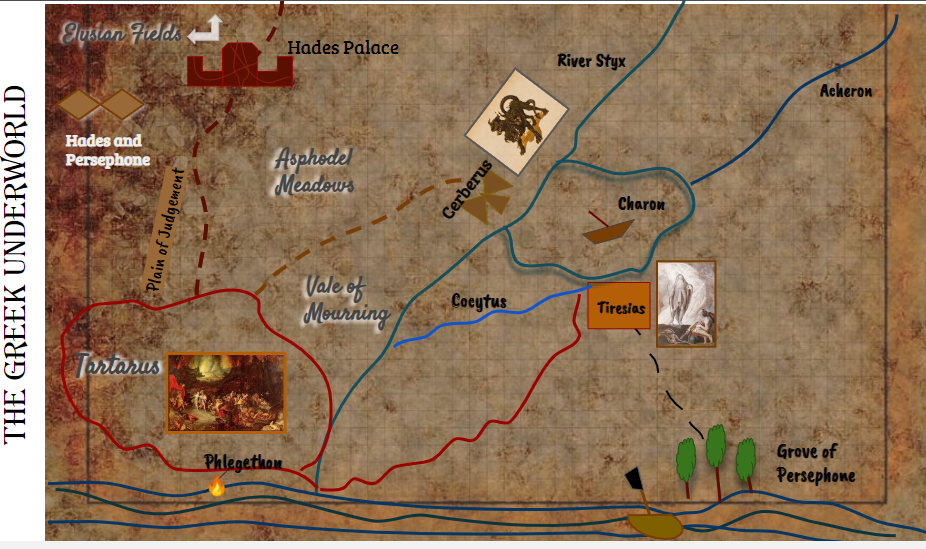
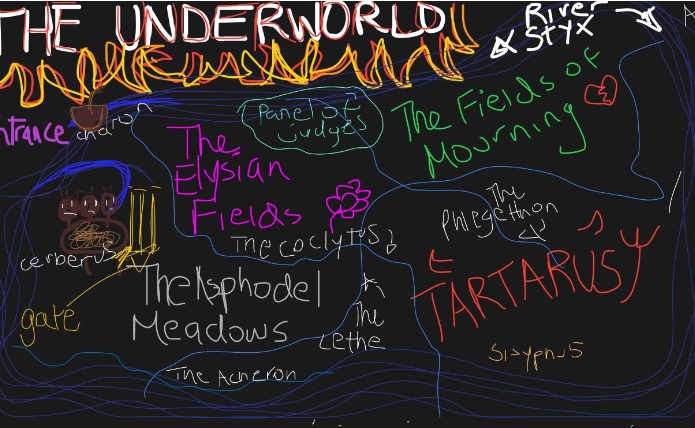
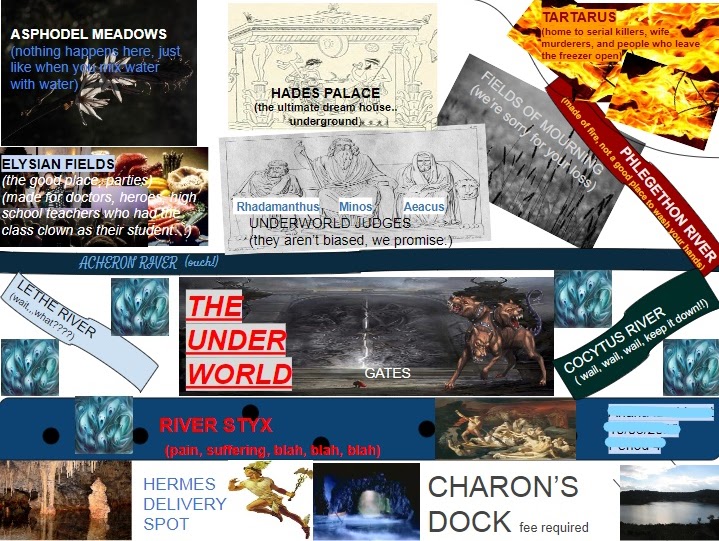
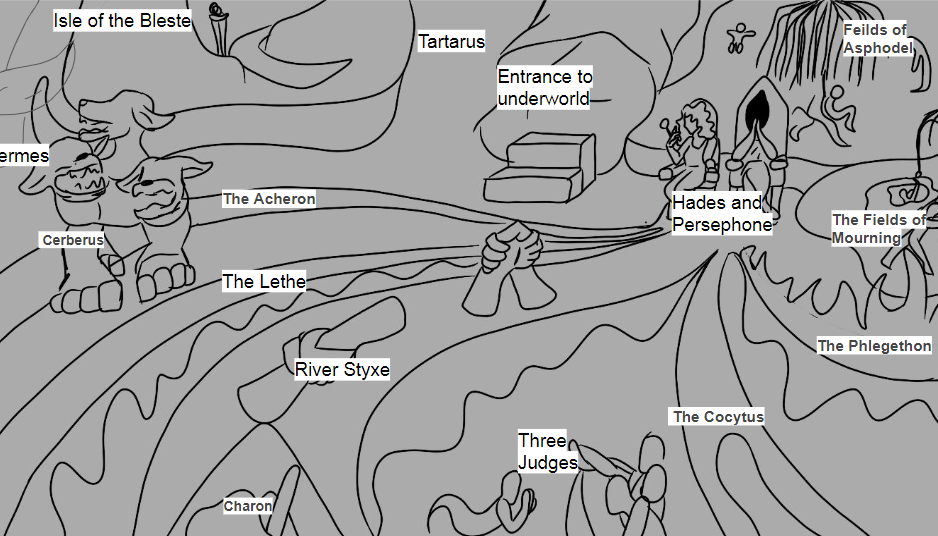
But this year, I also asked my students to create maps of their own for a different facet of the mythology: Odysseus’s descent to the Underworld. In Book 11, Odysseus must travel to Hades to consult with the ghost of a prophet about how to return to his home. The world of the Greek afterlife was a rich setting, and the different physical features and boundaries help us to understand the mood of the text. Below are some of my favorites, but check out some of the others!
4. Consider perspective, bias, and argument in visual texts.
Maps can not only help us to understand texts but can also be texts themselves. The same questions that we ask about other artifacts – speeches, political cartoons, advertisements – are equally valid when considering how mapmakers choose to represent physical space.
Consider the Mercator Projection’s racist origins and effect. Or take a look at the here-be-dragons maps of centuries past warning people not to veer too far away from the familiar.
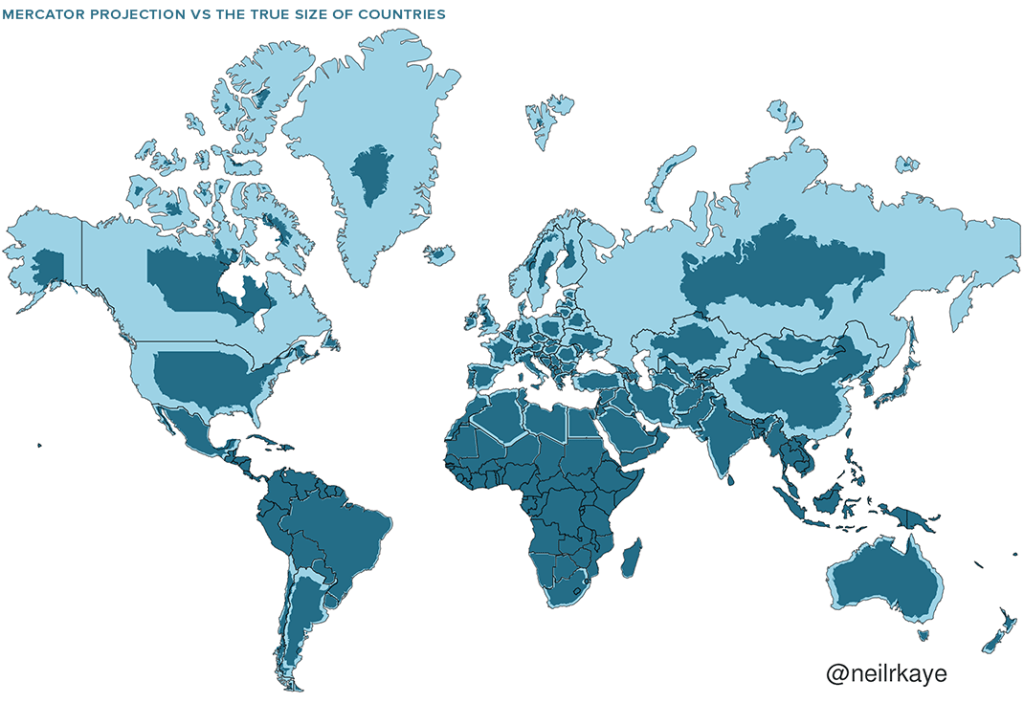
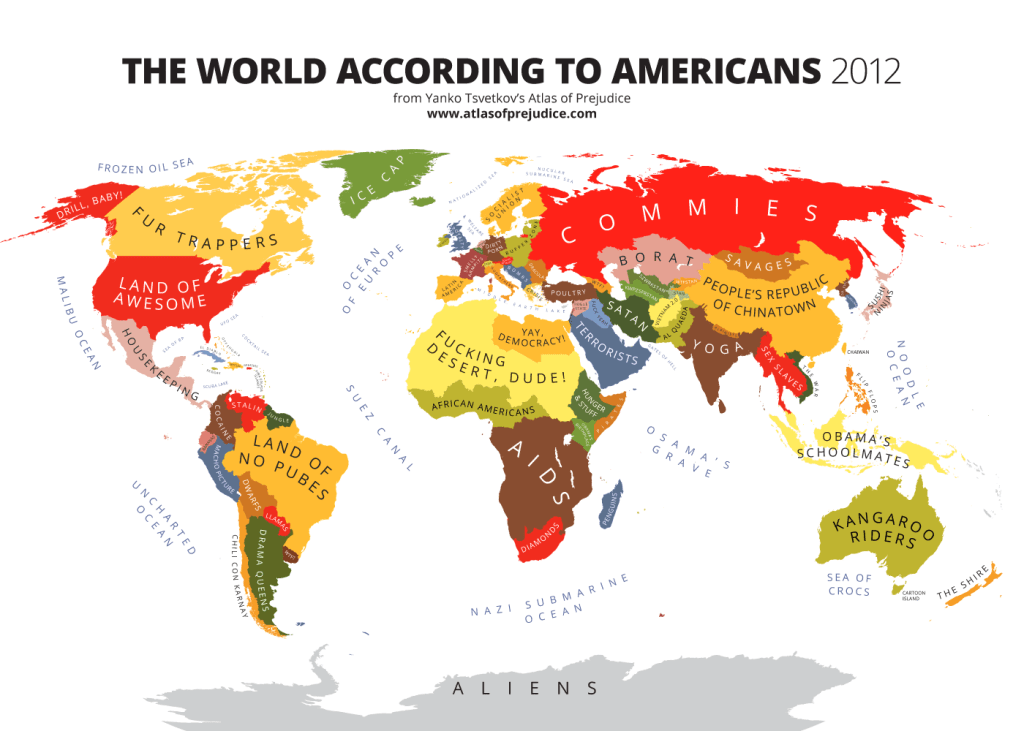
This article from National Geographic – “Why your mental map of the world is (probably) wrong” – invites teachers and students to check the ways in which our understanding of reality might be inconsistent with the truth and meditate on how we might have come by that false knowledge. And the Atlas of Prejudice – which I certainly wouldn’t use with younger students – would make a nice “body of work” for IB Language and Literature students or an element of the synthesis question for AP Language.
5. Visualize plot through metaphorical maps.
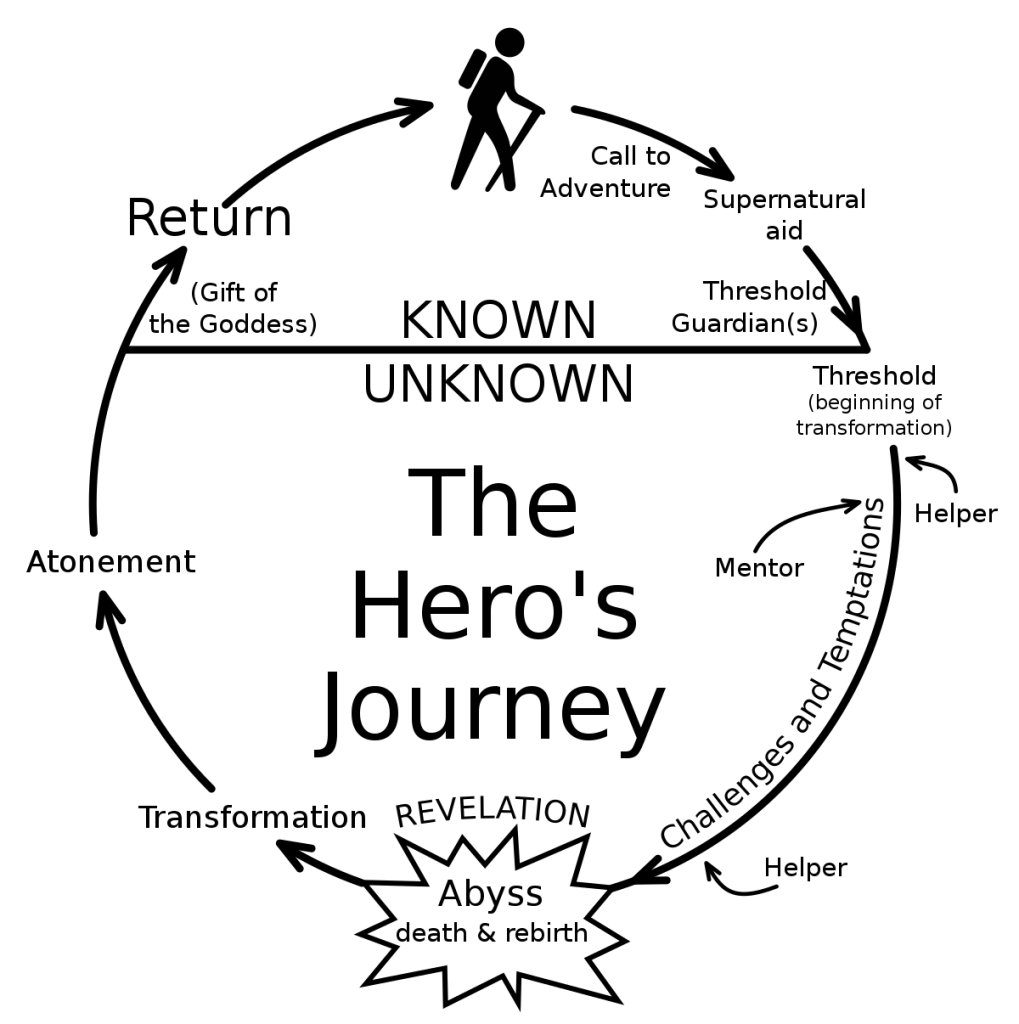
Finally, ELA teachers, I bet you’ve actually been using maps all along. If you’ve ever taught Campbell’s monomyth/the hero’s journey or Freytag’s triangle for plot, you’ve been using maps. Granted, this are models that demonstrate a character’s movement through metaphorical or emotional space, but that movement is often layered alongside a physical journey.

That’s it! Maybe there is a secret geography teacher in you too!
